A key question at the moment for me is: How long will the volume increase of 2013 persist, and what will that tell us about the time response of the pack and the forcings upon it? But I've just asked that question over at Neven's Sea Ice Blog, here, so I'll leave that for now. Anyone with ideas can comment here if they prefer. Some useful data might be the volume/thickness data for PIOMAS that I've calculated, link.
The Wright/Schaller paper on the Paleocene/Eocene Thermal Maximum (PETM) has caused quite a bit of excitement. Climate Progress have presented it as a PETM Shocker but don't seem to mention that the study, if correct, rules out methane emissions from land or sea as the cause. The paper is available here.
Wright/Schaller examine clay cores from what is now part of the Eastern US, the Salisbury Embayment, but in the end of the Paleocene was under 60m of sea water. They find that bands in the clay cannot have been due to orbital pacing (Milankovitch Cycles) because there is no evidence of pole shift during the section of core considered, and Milankovitch forcing would have been insufficient to drive the changes in Oxygen 18 (18O) isotope (a proxy for temperature) seen in the clay bands. They proceed to argue that the banding must be due to seasonal changes within the year, implying that each band (approx 2cm) is due to yearly cycles, and is therefore pacing out individual years. In support of this claim they cite other regions with deposition rates that exceed the implied rate so the bands could feasibly represent individual years.
So considering that 2cm is about a year, they present the following graphic showing the increase of Carbon 13 (13C) isotope indicating an influx into the carbon cycle of a mass of carbon with less 13C in it. The graph's timeline proceeds from right to left.
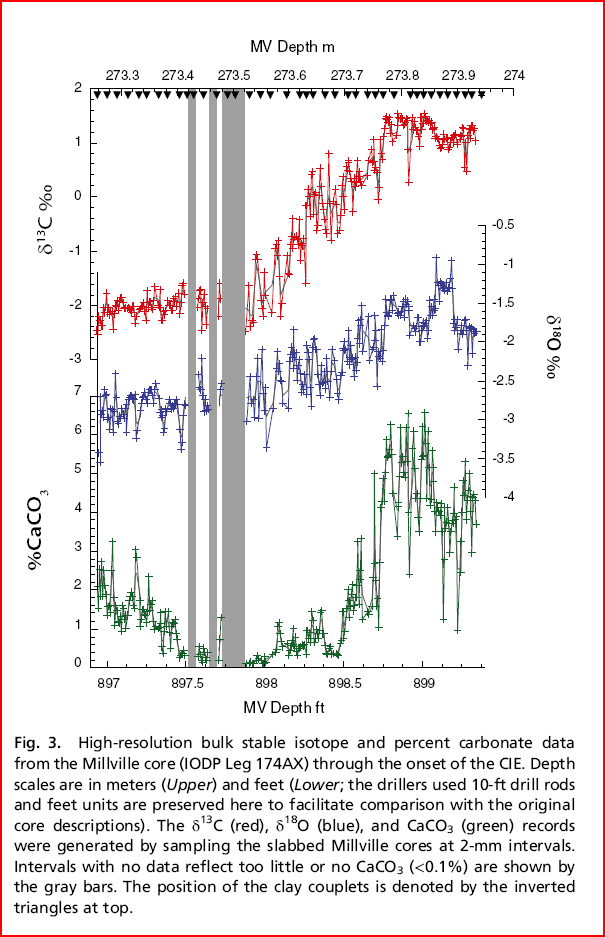
The shift in calcium carbonate (CaCO3) happens within weeks, whereas the physical movement of 13C takes something of the order of a decade (see Revell/Suess 1957). So proceeding from right to left, first the CaCO3 concentration drops, and it drops sharply, while at about the same time a more gradual drop in 13C starts. Looking at the scale, this takes 30cm, or about 15 years (2cm per year), the authors state it's 13 years, or 13 striations of the clay core. If the assumptions with regards the striations being years is correct then this implies that the initial injection of 13C depleted carbon almost all happens within a few years, and I'm talking 1 to 4 years! Human emissions are around 9 Gtons carbon per year (much faster than earlier rates of emission estimated for the PETM, see here), Wright/Schaller estimate that 3000Gt non-biogenic carbon was needed to account for the 13C excursion identified, all within a few years!
Frankly that's the bit I find hard to swallow. The authors cite the discovery of ferrite nanoparticles that could indicate an asteroid/comet impact as the cause, they also mention thermogenic methane, for example an igneous intrusion into a coal bed. I'm having a hard time accepting that either source could deliver 3000 Gtons in a few years.
However it this paper is correct it is fatal for the presumed methane role in the PETM, biogenic methane would only need to involve an emission of 1200 Gtons in a few years. There is simply no way there could be an orchestrated global destabilisation of methane hydrates within a few years. And Shakhova's now famous alarm call was warning of just 50Gtons of methane as 'highly possible for abrupt release at any time'.
So I really don't know what to make of this paper. I can't fault their logic with regards timing of the striations in the cores, but I can't conceive of a way to get thousands of gigatons of 13C depleted carbon into the atmosphere with a few years. Anyway, it doesn't change my opinion about the current Arctic methane threat, it's likely to be chronic, not catastrophic, but still has the potential to amplify anthropogenic global warming significantly.
As the US continues to saw away on the very branch it's sitting on.... PIOMAS depends on NCEP/NCAR so it hasn't released for September yet. CT Area seems to depend on NSIDC, which has stopped releasing data. I depend on NCEP/NCAR, NSIDC, and CT Area, so I'm rather stuck.
When I was in the process of ditching my scepticism IPCC Fourth Assessment Report (AR4) came out. As an exercise I decided to trace through some of the references to see if my fellow denialists were right that the IPCC was doctoring the science. What did I find? The references supported the Working Group 1 Scientific Basis document in all the randomly chosen cases. I won't be wasting my time doing that this time around.
Anyway, IPCC AR5 Summary for Policy Makers has been out for some weeks, long enough for me to read it and ponder. No surprises, but I still think they're overly cautious, I see no room for reasonable doubt that we're responsible for all the post 1975 warming, and more that's not yet manifested due to the post 2002 hiatus.
But I've also been reading Hansen's Storms of My Grandchildren (slow going because I generally only read at bed time and it's neither sci-fi nor supernatural horror) and it has lead me to download Hansen's latest paper, but before I get to that, here's the chart of radiative forcings from IPCC AR5.
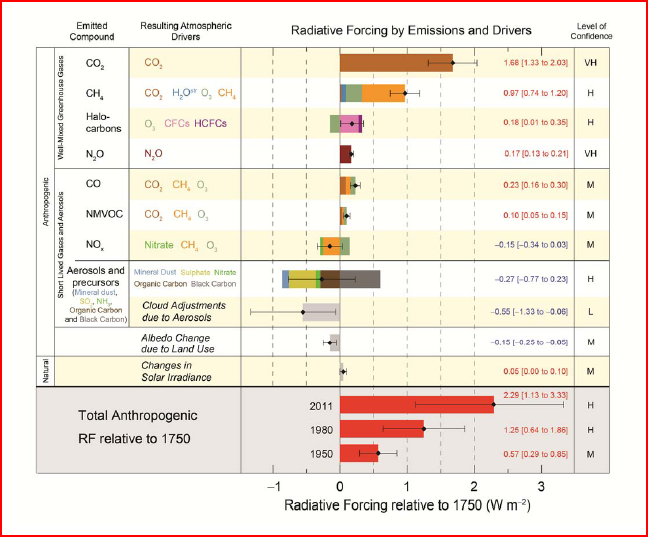
Methane has gone up largely due to greater understanding of secondary forcings (from decomposition products), CO2 is starting to betray what a monster it is. Human caused (anthropogenic) radiative forcing has almost doubled (central value), but so has the uncertainty, mainly due to negative anthropogenic forcings and uncertainty over cloud response.
"Climate sensitivity, sea level and atmospheric carbon dioxide" by Hansen et al (2013) has been published in the legendary Philosophical Transactions of the Royal Society, link. In it Hansen et al use the temperature change from the previous ice age to the holocene to estimate fast climate feedback sensitivity. They find that due to long standing uncertainties about the temperature change the fast feedback sensitivity can be constrained to 0.75 to 0.5 Watts/m^2/degC.
What happens when this sensitivity is applied to IPCC total anthropogenic forcing for 2011? I've used both those figures and applied them to the upper/central/lower values for anthropogenic forcings from the above figure, but before plotting in the following I've subtracted 0.8degC, which is approximately the warming since pre-industrial, because virtually all of this is due to human activity.
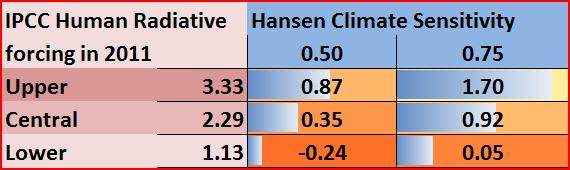
Radiative forcing is in Watts/m^2, climate sensitivity is in Watts/m^2/degC, the calculated committed warming to come is in degC (I don't do Fahrenheit!). It's apparent that using the lower bound of radiative forcing with either of Hansen's climate sensitivity gives the unrealistic result that there is no 'warming in the pipeline', or committed warming. But at the higher end the committed warming could be over 1 degree.
2 comments:
Hi Chris,
As I said on neven's forum this is a wonderfully clear treatment of the issues covered.
Just one suggestion for now:
In the last table, clearly label which column is what.
Am I right in assuming that it is in the last column that 'committed warming' is indicated?
(And thanks to sticking with degrees C for that!)
Great blog!
wili
Sorry I thought it would be clear from a preceding paragraph: Hansen's fast feedback sensitivity is between 0.5 and 0.75 W/m^2, the last two columns are the warming to come (allowing for 0.8degC warming so far), using Hansen's 0.5 and 0.75W/m^2.
So you have two columns for Hansen's fast feedback sensitivity, and three rows for IPCC AR5 2011 radiative forcing. At each intersection is the committed warming for each combination of climate sensitivity and IPCC anthropogenic forcing.
Hope that corrects my lack of clarity.
Post a Comment